

Candlestick patterns are shapes formed by one or more candles on a price chart that traders use to read market sentiment. Each candle sums up four prices for a set period: the open, the close, the high and the low. That makes candlestick charts the most popular way to follow price action, in crypto as much as in stocks or forex.
This guide explains how to read a candlestick chart, which candle types appear most often, and which bullish, bearish and reversal candlestick patterns are worth knowing. It also covers how to use them without falling into common traps. Keep one thing in mind throughout: candles describe what has already happened. They can help you weigh probabilities, but no pattern guarantees what the price will do next.
Where candlestick charts come from
Candlestick charting is generally traced back to 18th-century Japan, where it was used to track rice prices. It later spread to Western markets and is now the default chart type on almost every trading platform, including those for Bitcoin and other digital assets.
A line chart only connects closing prices. A candle also shows how far the price travelled during the period, which reveals buying or selling pressure, hesitation, and levels the market rejected. If you are still finding your feet, our guide to choosing the right crypto exchange is a good place to start.
Anatomy of a candle
Every candle has two main parts:
- Body: the thick section between the opening and closing price.
- Wicks (or shadows): the thin lines above and below the body. The upper wick marks the period's high and the lower wick marks its low.
The colour tells you the direction:
- Bullish candle: the close is above the open. It is usually green (or white on classic charts).
- Bearish candle: the close is below the open. It is usually red (or black).
Colour settings vary between platforms, so check them before you start reading a chart.
How to read candlestick charts step by step
Pick a timeframe
Each candle can represent 1 minute, 15 minutes, 1 hour, 4 hours, 1 day, 1 week or another period. The same shape carries different weight depending on the timeframe. Short timeframes produce many signals and a lot of noise, while daily or weekly candles produce fewer signals that tend to matter more. Day traders focus on short candles, and long-term investors usually look at daily or weekly charts.
Look at body size
A large body shows strong, one-sided movement. A small body points to balance or indecision between buyers and sellers.
Read the wicks
A long wick means the price reached a level but could not hold it. A long lower wick, for example, shows that sellers pushed the price down and buyers then stepped in and drove it back up. Much of candlestick analysis is built on this idea of rejection.
Always consider context
A single candle tells you little on its own. It becomes meaningful when you compare it with the prior trend, key support and resistance levels, and trading volume.
Common single-candle types
Doji
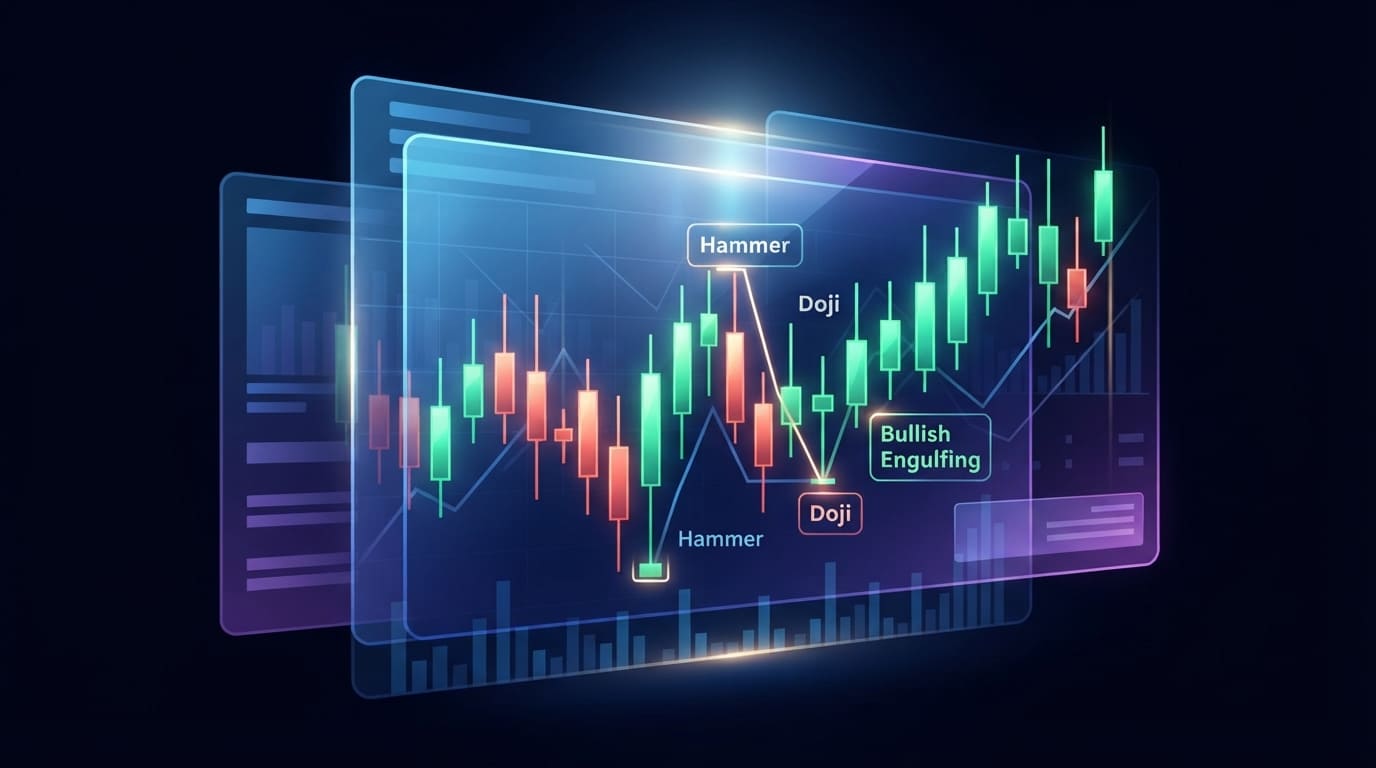
A doji has a tiny or non-existent body because the open and close are almost identical. It signals indecision. After a long trend it can hint that momentum is fading, but it does not confirm a reversal by itself.
Hammer and inverted hammer
A hammer has a small body near the top and a long lower wick. When it appears after a decline, it suggests buyers rejected lower prices. An inverted hammer has the long wick on top and is also read as potentially bullish after a downtrend.
Hanging man and shooting star
These look like the hammer and inverted hammer but appear after a rally. In that position they are read as potentially bearish, because the market struggled to hold higher prices.
Marubozu
A marubozu is a large-bodied candle with little or no wick. It shows that one side controlled the whole period: buyers if it is green, sellers if it is red.
Spinning top
A spinning top has a small body with wicks of similar length on both sides. Like the doji, it reflects a stand-off between buyers and sellers.
Key candlestick patterns to know
Patterns combine two or more candles. Technical analysts use them to spot possible reversals or trend continuation.
Bullish reversal candlestick patterns
- Bullish engulfing: a bearish candle followed by a bullish candle whose body completely covers the previous one. It suggests buyers have taken over.
- Morning star: three candles. First a large bearish candle, then a small-bodied candle (often a doji), and finally a bullish candle that closes well into the first candle's body or above it.
- Piercing line: a bearish candle followed by a bullish one that opens lower and closes above the midpoint of the previous body.
Bearish reversal candlestick patterns
- Bearish engulfing: a bullish candle that is fully covered by a larger bearish candle.
- Evening star: the bearish mirror of the morning star, which typically appears near highs.
- Dark cloud cover: a bullish candle followed by a bearish one that opens higher and closes below the midpoint of the previous body.
Continuation patterns
- Three white soldiers: three consecutive bullish candles, each closing higher than the last. It is linked to sustained buying pressure.
- Three black crows: three consecutive bearish candles with progressively lower closes. It reflects persistent selling.
No pattern works every time. Patterns shift the odds rather than set them, and how reliable they are varies with the asset, the timeframe and market conditions.
What's different about crypto candlestick charts
- 24/7 trading: there is no market close. The daily candle closes at a reference time set by the platform, usually in UTC.
- Higher volatility: long wicks are common, especially on lower-liquidity altcoins. Sharp moves can produce signals that never follow through.
- Fewer gaps: because trading never stops, gaps between candles are rare on liquid pairs. Some classic stock-market patterns therefore show up less often.
- Sentiment-driven swings: during a crypto bull run, bearish signals tend to fail more often, and the opposite holds in bear markets.
Combining candlesticks with other tools
- Support and resistance: a hammer at a well-tested support level carries more weight than one in the middle of a range.
- Volume: patterns that form on above-average volume are generally considered more meaningful.
- Overall trend: trading with the broader trend is usually more prudent than constantly hunting for reversals.
- Indicators: moving averages or the RSI can help confirm or rule out a reading.
- Risk management: decide in advance where your idea is invalidated, and use the right order types, such as stop-loss and take-profit orders, to manage your exits.
Mistakes to avoid
- Trading off one candle: without context or confirmation, a single candle is a weak signal.
- Ignoring the timeframe: a pattern on a 1-minute chart does not carry the same weight as one on a daily chart.
- Acting before the candle closes: a candle is not complete until its period ends, and it can change shape in the final minutes.
- Seeing patterns everywhere: forcing a reading to justify a trade you already want to make is a common bias.
- Skipping risk control: even a textbook pattern can fail. Without an exit plan, one bad trade can do serious damage.
Practising with candlestick charts on Palzea
On Palzea you can open candlestick charts for the main trading pairs from the markets section and follow each asset on the crypto prices page. It is a practical way to train your eye: switch timeframes, compare how the same move looks on different charts, and keep notes on which patterns confirm and which fail.
When you are ready to trade, start with a clear plan and check the trading fees so you know the real cost of each position. Palzea includes account protection, risk monitoring and clear trading flows, but your own habits matter too: turn on two-factor authentication and never risk money you cannot afford to lose. If you have questions about the platform, our support team is there to help.
Candlestick patterns FAQ
What does a candle's colour mean?
It shows whether the price closed above or below its opening level for that period. On most platforms green means bullish and red means bearish, although colours can be customised.
What is the most reliable candlestick pattern?
No pattern is reliable in every situation. Engulfing patterns and morning and evening stars are among the most widely studied, but their usefulness depends on context, timeframe and confirmation.
Do candlestick patterns work the same in crypto as in stocks?
You read them the same way, but crypto trades around the clock, is more volatile and rarely gaps on liquid pairs. Those differences affect how some patterns form.
Which timeframe is best for beginners?
Many beginners start with 4-hour or daily charts, which have less noise and leave more time to think. Very short timeframes require fast decisions and tighter risk management.
Are candlesticks enough to trade on their own?
It is not advisable. Candlesticks are a price-reading tool and work best alongside support and resistance, volume, indicators and, above all, a solid risk management plan.
Final thoughts
Candlesticks turn raw price data into a picture you can read at a glance. Learning the main candlestick patterns helps you understand market behaviour, spot potential turning points and plan trades more deliberately. Practise patiently, study plenty of charts and always pair what you see with sound risk management. A good place to start is the Bitcoin chart on Palzea, where you can put what you have learned into practice step by step.
Risk warning: cryptocurrencies are highly volatile and their prices can move sharply in a short time. This content is for information only and is not financial advice. Technical analysis does not guarantee results. Only trade with money you can afford to lose.